Market Outlook
July 27, 2017
Market Cues
Domestic Indices
Chg (%)
(Pts)
(Close)
Indian markets are likely to open flat tracking global indices and SGX Nifty.
BSE Sensex
0.5
154
32,382
U.S. markets mostly higher on the back of strong earnings and following the Federal
Nifty
0.6
56
10,021
Reserve's decision to keep interest rates unchanged. The Fed was widely expected to
Mid Cap
0.2
27
15,340
keep monetary policy steady. The central bank, however, laid the groundwork for
Small Cap
0.3
144
16,099
winding down its massive stimulus program in September.
Bankex
0.7
205
27,962
The European markets posted gains in early trade Wednesday, before settling into a
sideways pattern. Solid U.K. GDP data and a number of positive corporate financial
Global Indices
Chg (%)
(Pts)
(Close)
reports helped the markets to log modest gains. Energy stocks also benefitted from
the continued rise in crude oil prices.
Dow Jones
0.5
198
21,711
Nasdaq
0.1
11
6,423
A surge in late-session buying on the back of positive global cues helped India's
FTSE
0.24
18
7,452
benchmark indexes Sensex and the Nifty end at fresh record highs on Wednesday.
Nikkei
(00.5
95
20,050
The BSE Sensex rose 154 points or 0.5% to 32,382 while the broader Nifty index
Hang Seng
0.3
289
26,941
finished up 56 points or 0.6% at 10,021, closing above 10,000 for the first time
Shanghai Com
0.1
4
3,248
ever.
Result Preview and Review
Advances / Declines
BSE
NSE
Preview: Dr. Reddy’s Labs & HCL Tech
Advances
1,329
1,843
Declines
1,374
838
Review: Yes Bank
Unchanged
174
74
Detailed analysis is on Pg2
Investor’s Ready Reckoner
Volumes (` Cr)
Key Domestic & Global Indicators
BSE
4,053
Stock Watch: Latest investment recommendations on 150+ stocks
NSE
29,075
Refer Pg7 onwards
#Net Inflows (` Cr)
Net
Mtd
Ytd
Top Picks
CMP
Target
Upside
FII
(56321
( 1,471
57,379
Company
Sector
Rating
(`)
(`)
(%)
MFs
1,038
6,239
45,385
Blue Star
Capital Goods
Accumulate
697
760
9.0
Dewan Housing FinanceFinancials
Buy
459
550
19.9
Mahindra Lifespace
Real Estate
Buy
428
522
21.9
Top Gainers
Price (`)
Chg (%)
Navkar Corporation
Others
Buy
202
265
31.0
Get&Dm
393
19.9
KEI Industries
Capital Goods
Accumulate
233
258
10.8
Sparc
360
9.2
More Top Picks on Pg5
Jindalstel
152
8.4
Key Upcoming Events
Jpassociat
29
7.6
Previous
Consensus
Date
Region
Event Description
Reading
Expectations
Mmtc
62
6.4
Jul 27, 2017
US
FOMC rate decision
1.25
1.25
Jul 28, 2017
Euro Zone Euro-Zone Consumer Confidence
(1.70)
(1.70)
Top Losers
Price (`)
Chg (%)
Jul 28, 2017
Germany PMI Manufacturing
58.30
-
Renuka
220
(6.5)
Jul 31, 2017
US
GDP Qoq (Annualised)
1.40
2.50
Lakshvilas
183
(6.0)
Aug 01, 2017 China
PMI Manufacturing
51.70
51.50
More Events on Pg7
Sreinfra
124
(3.6)
Federalbnk
115
(3.6)
Orientbank
152
(3.4)
#as on 26t July, 2017
Market Outlook
July 27, 2017
Result Preview
Dr Reddy’s Lab (CMP: `2,705 / TP: /Upside :)
Dr Reddy’s Labs, is expected to put the up sales of `3,636cr in 1QFY2018 V/s
`3,235cr, a yoy growth of 12.4%. On operating front, the EBDITA is expected to
come in at 16.1% in 1QFY2018 V/s 11.7% in 1QFY2017. Consequently, the PAT
is expected to come at `321cr in 1QFY2018 V/s `126cr in 1QFY2017, a yoy
growth of 154.5%. We maintain our neutral rating on the stock.
Y/E
Sales OPM
PAT
EPS ROE P/E P/BV EV/EBITDA EV/Sales
March
(` cr)
(%)
(` cr)
(`)
(%)
(x)
(x)
(x)
(x)
FY2018E
15,937
18.6
1,757
105.9
13.6
25.5
3.3
16.2
3.0
FY2019E
18,079
18.2
1,967
118.7
13.7
22.8
3.0
14.6
2.7
HCL Tech (CMP: `889 / TP: `1014/Upside: 14.1%)
HCL Tech for 1QFY2018 is expected to announce good set of numbers. The sales
is expected to come in at US$1,891mn V/s US$1,817mn in 4QFY2017, a qoq
growth of 4.1% qoq. In Rupee terms, the sales are expected to be come in at
`12,208cr V/s `12,053cr in 4QFY2017, a qoq growth of 1.3%. On the operating
profit front the EBIT came in at 19.5% V/s 20.0% in 4QFY2017, a qoq dip of
55bps. The PAT is expected to come in at `2,101cr V/s `2,325cr in 4QFY2017, a
qoq dip of 9.6%. We maintain our buy rating on the stock.
Y/E
Sales OPM
PAT
EPS ROE P/E P/BV EV/EBITDA EV/Sales
March
(` cr)
(%)
(` cr)
(`)
(%)
(x)
(x)
(x)
(x)
FY2018E
52,342
20.9
8,860
62.8
22.4
14.2
3.2
9.7
2.0
FY2019E
57,053
20.9
9,536
67.6
20.6
13.1
2.7
8.4
1.8
Result Review
Strong operating performance and improving asset quality to ensure healthy
bottom-line growth for Yes Bank going ahead:
Yes Bank’s Q1FY18 results have been in line with expectations. For five
consecutive quarters the bank has been delivering loan growth above 30%, with
growth in Q1FY18 coming in at 32%. Deposit growth also remained strong at
22.6%. Yes Bank has been aggressively expanding its CASA base and now the
CASA ratio has gone up to 36.5% a gain of 690 bps over last year. One of the
large cement accounts was recognised as NPAs during Q4FY17 and hence the
asset quality has seen deterioration with GNPAs going up to 1.50% in Q4FY17 vs
0.85% in Q3FY17.
Market Outlook
July 27, 2017
However, during that time the management was fairly confident that the account
will get regularised and accordingly there has been recovery from that account.
This has resulted in GNPAs has come down by `654 cr in absolute terms and 55
bps QoQ to 0.97%. With asset quality concerns easing and core operations
remaining strong the earnings visibility of the bank has improved. The stock is
trading at 2.7x its FY19E Book Value. We upgrade the stock to ACCUMULATE.
Economic and Political News
No plans to take up delayed residential projects of private builders: Govt
GST impact: CNG price hiked by `1.1 a kg in Delhi, still cheaper than NCR
Continued decline in telcos revenue to impact govt collections: Manoj Sinha
Corporate News
Maruti Suzuki launches first Nexa service centre, eyes 300 outlets by 2020
PVR Q1 net rises 4% at `44cr
Indiabulls Housing Finance Q1 net rises 25% to `788cr
Market Outlook
July 27, 2017
Top Picks ★★★★★
Market Cap
CMP
Target
Upside
Company
Rationale
(` Cr)
(`)
(`)
(%)
Strong growth in domestic business due to its leadership
in acute therapeutic segment. Alkem expects to launch
Alkem Laboratories
22,045
1,844
2,161
17.2
more products in USA, which bodes for its international
business.
We expect the company would report strong profitability
Asian Granito
1,255
417
480
15.1
owing to better product mix, higher B2C sales and
amalgamation synergy.
Favourable outlook for the AC industry to augur well for
Cooling products business which is out pacing the
Blue Star
6,679
697
760
9.0
market growth. EMPPAC division's profitability to improve
once operating environment turns around.
With a focus on the low and medium income (LMI)
consumer segment, the company has increased its
Dewan Housing Finance
14,384
459
550
19.9
presence in tier-II & III cities where the growth
opportunity is immense.
Loan growth is likely to pick up after a sluggish FY17.
Karur Vysya Bank
8,297
137
160
16.5
Lower credit cost will help in strong bottomline growth.
Increasing share of CASA will help in NIM improvement.
High order book execution in EPC segment, rising B2C
KEI Industries
1,812
233
258
10.8
sales and higher exports to boost the revenues and
profitability
Speedier execution and speedier sales, strong revenue
Mahindra Lifespace
2,197
428
522
21.9
visibilty in short-to-long run, attractive valuations
Massive capacity expansion along with rail advantage at
Navkar Corporation
2,885
202
265
31.0
ICD as well CFS augurs well for the company
Strong brands and distribution network would boost
Siyaram Silk Mills
2,170
2,315
2,500
3.0
growth going ahead. Stock currently trades at an
inexpensive valuation.
Market leadership in Hindi news genre and no.
2
viewership ranking in English news genre, exit from the
TV Today Network
1,453
244
344
41.2
radio business, and anticipated growth in ad spends by
corporates to benefit the stock.
After GST, the company is expected to see higher
volumes along with improving product mix. The Gujarat
Maruti
2,28,915
7,578
8,495
12.1
plant will also enable higher operating leverage which
will be margin accretive.
Source: Company, Angel Research,
Market Outlook
July 27, 2017
Key Upcoming Events
Global economic events release calendar
Bloomberg Data
Date
Time
Country
Event Description
Unit
Period
Last Reported
Estimated
Jul 26, 2017
2:00 PMUK
GDP (YoY)
% Change
2Q A
2.00
1.70
11:30 PMUS
FOMC rate decision
%
Jul 26
1.25
1.25
7:30 PMUS
New home sales
Thousands
Jun
610.00
615.00
Jul 27, 2017
6:00 PMUS
Initial Jobless claims
Thousands
Jul 22
233.00
240.00
Jul 28, 2017
6:30 AMChina
PMI Manufacturing
Value
Jul
51.70
51.50
2:30 PMEuro Zone
Euro-Zone Consumer Confidence
Value
Jul F
(1.70)
(1.70)
Jul 31, 2017
6:00 PMUS
GDP Qoq (Annualised)
% Change
2Q A
1.40
2.50
Aug 01, 2017
1:25 PMGermany
PMI Manufacturing
Value
Jul F
58.30
1:25 PMGermany
Unemployment change (000's)
Thousands
Jul
7.00
2:00 PMUK
PMI Manufacturing
Value
Jul
54.30
2:30 PMEuro Zone
Euro-Zone GDP s.a. (QoQ)
% Change
2Q A
0.60
Aug 02, 2017
2:30 PMIndia
RBI Reverse Repo rate
%
Aug 2
6.00
5.75
2:30 PMIndia
RBI Repo rate
%
Aug 2
6.25
6.00
2:30 PMIndia
RBI Cash Reserve ratio
%
Aug 2
4.00
4.00
Aug 03, 2017
1:25 PMGermany
PMI Services
Value
Jul F
53.50
4:30 PMUK
BOE Announces rates
% Ratio
Aug 3
0.25
0.25
Aug 04, 2017
6:00 PMUS
Unnemployment rate
%
Jul
4.40
4.30
6:00 PMUS
Change in Nonfarm payrolls
Thousands
Jul
222.00
178.00
Aug 08, 2017
China
Exports YoY%
% Change
Jul
11.30
Aug 09, 2017
7:00 AMChina
Consumer Price Index (YoY)
% Change
Jul
1.50
Aug 10, 2017
India
Imports YoY%
% Change
Jul
19.00
Source: Bloomberg, Angel Research
Market Outlook
July 27, 2017
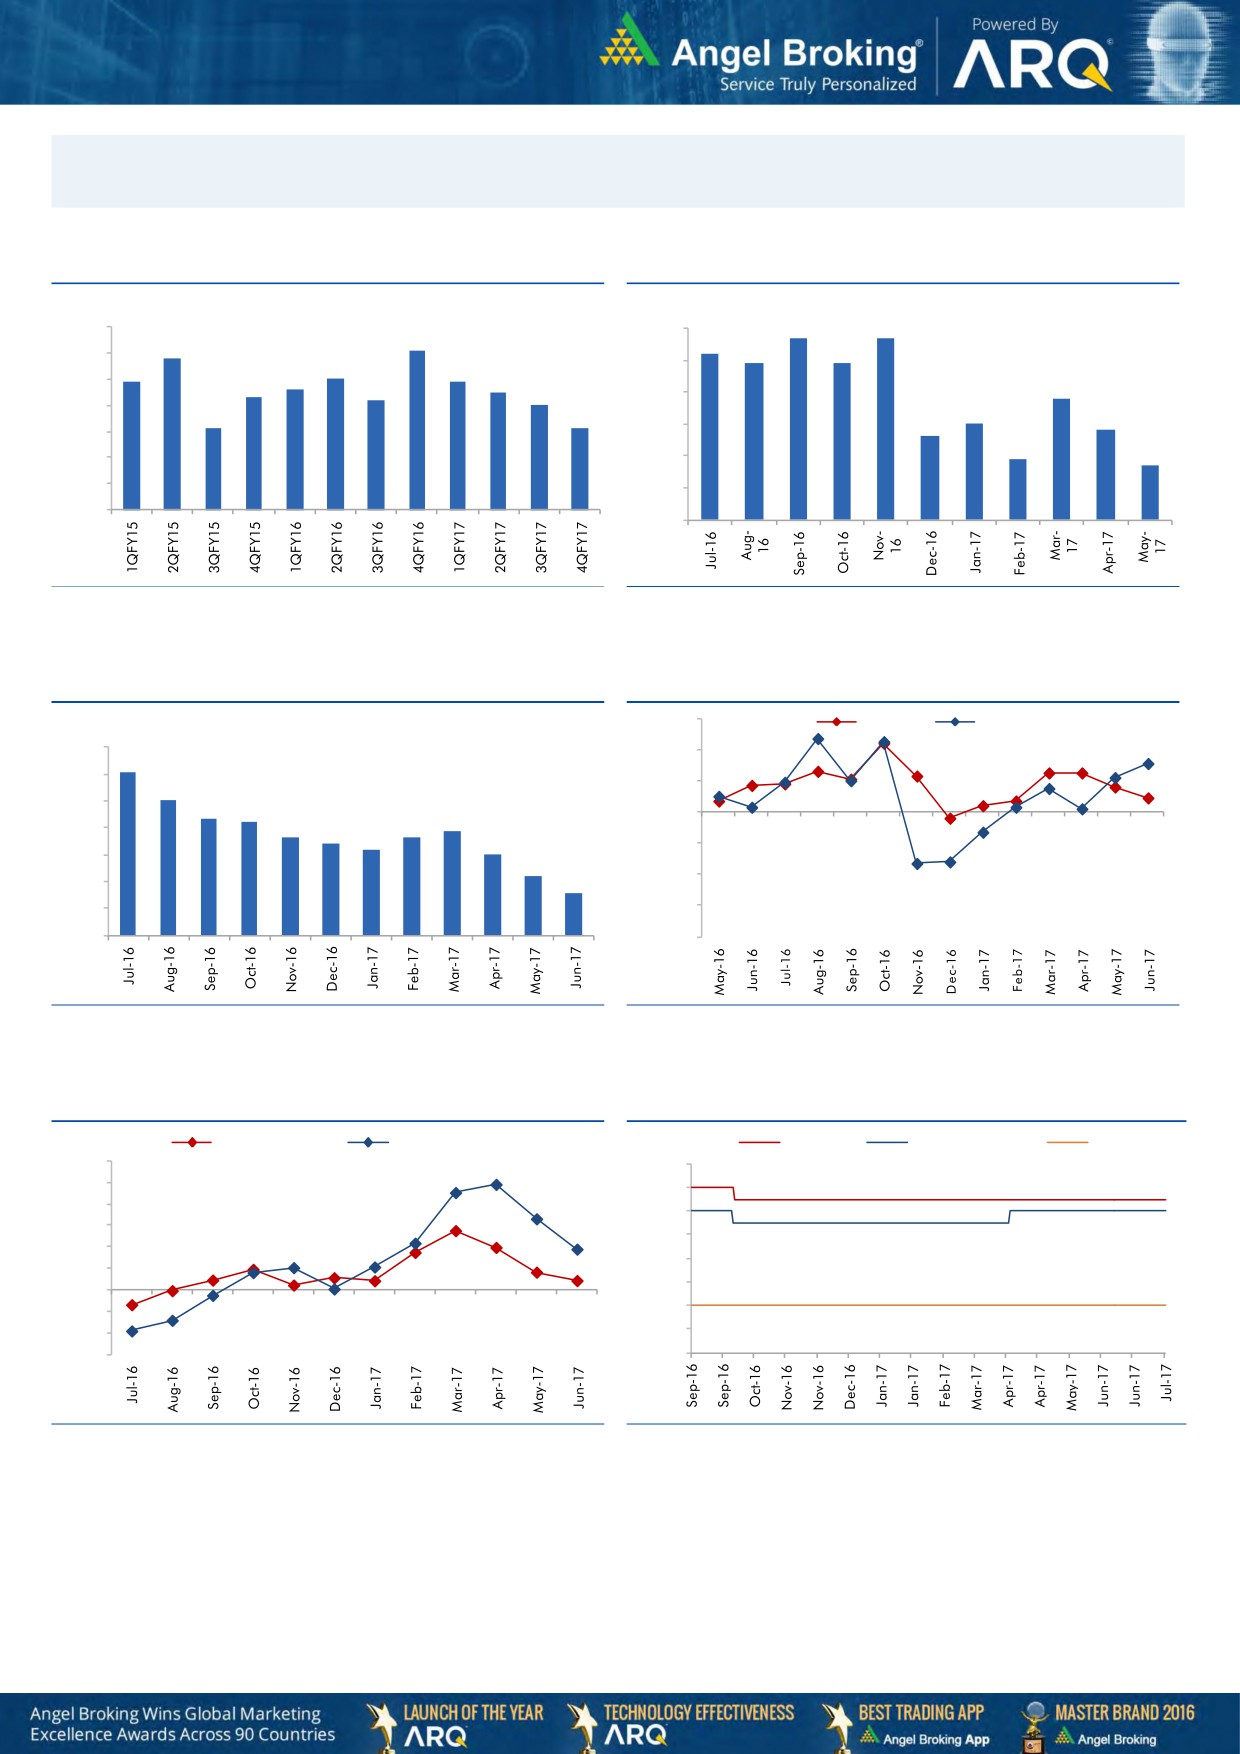
Macro watch
Exhibit 1: Quarterly GDP trends
Exhibit 2: IIP trends
(%)
(%)
5.7
5.7
10.0
6.0
9.1
5.2
8.8
4.9
4.9
9.0
7.9
8.0
7.9
5.0
7.6
7.5
8.0
7.3
7.2
3.8
7.0
4.0
7.0
3.0
6.1
6.1
2.8
2.6
3.0
6.0
1.9
1.7
5.0
2.0
4.0
1.0
3.0
-
Source: CSO, Angel Research
Source: MOSPI, Angel Research
Exhibit 3: Monthly CPI inflation trends
Exhibit 4: Manufacturing and services PMI
56.0
Mfg. PMI
Services PMI
(%)
7.0
54.0
6.1
6.0
5.1
52.0
5.0
4.3
4.2
3.9
50.0
3.6
3.7
4.0
3.4
3.2
3.0
48.0
3.0
2.2
1.5
46.0
2.0
1.0
44.0
-
42.0
Source: MOSPI, Angel Research
Source: Market, Angel Research; Note: Level above 50 indicates expansion
Exhibit 5: Exports and imports growth trends
Exhibit 6: Key policy rates
(%)
Exports yoy growth
Imports yoy growth
(%)
Repo rate
Reverse Repo rate
CRR
60.0
7.00
50.0
6.50
40.0
6.00
30.0
5.50
20.0
5.00
10.0
4.50
0.0
4.00
(10.0)
(20.0)
3.50
(30.0)
3.00
Source: Bloomberg, Angel Research
Source: RBI, Angel Research
Market Outlook
July 27, 2017
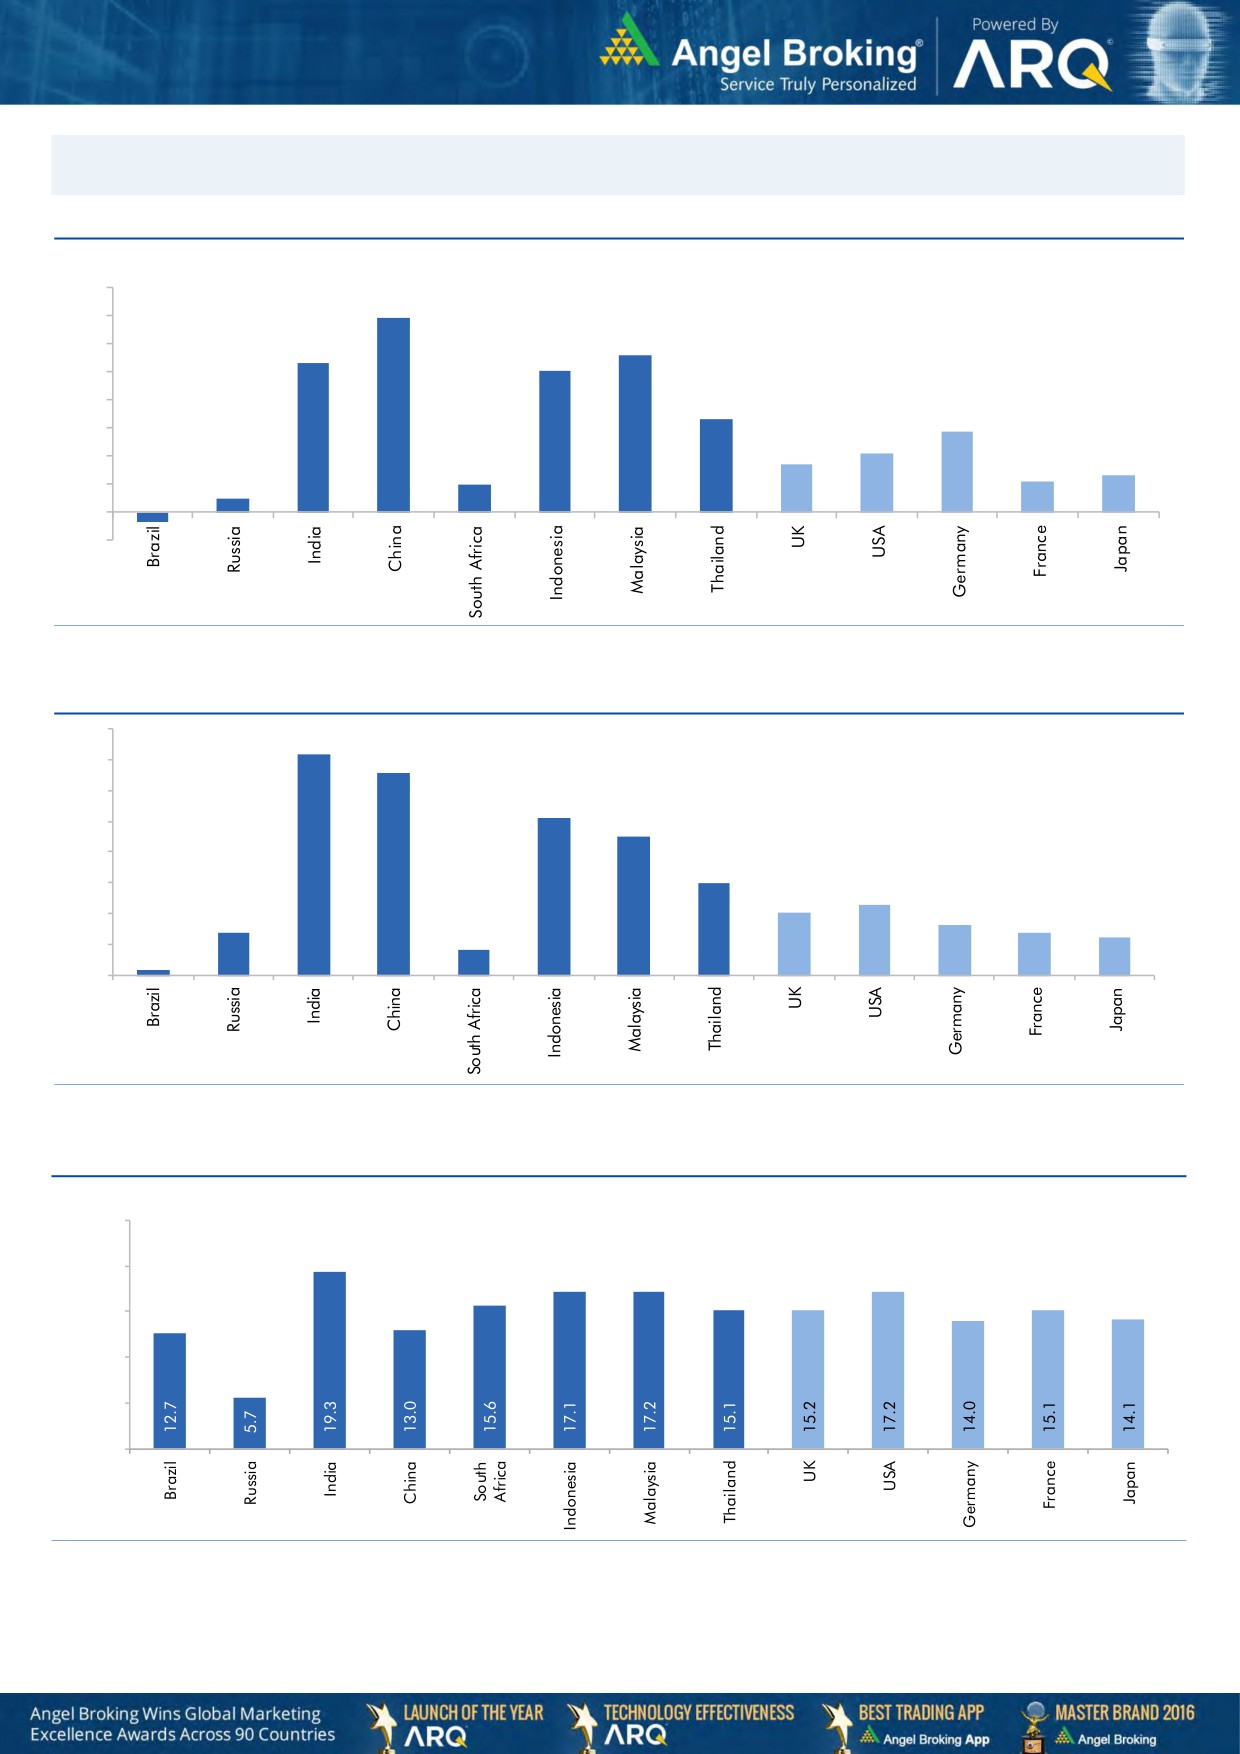
Global watch
Exhibit 1: Latest quarterly GDP Growth (%, yoy) across select developing and developed countries
(%)
8.0
6.9
7.0
5.6
6.0
5.3
5.0
1.0
5.0
4.0
3.3
2.9
3.0
2.1
0.5
1.7
2.0
1.1
1.3
1.0
-
(1.0)
(0.4)
Source: Bloomberg, Angel Research
Exhibit 2: 2016 GDP Growth projection by IMF (%, yoy) across select developing and developed countries
(%)
7.2
7.0
6.6
6.0
5.1
5.0
4.5
4.0
3.0
3.0
2.3
2.0
1.4
1.6
2.0
1.4
1.2
0.2
0.8
1.0
-
Source: IMF, Angel Research
Exhibit 3: One year forward P-E ratio across select developing and developed countries
(x)
25.0
20.0
15.0
10.0
5.0
-
Source: IMF, Angel Research
Stock Watch
July 27, 2017
Company Name
Reco
CMP
Target
Mkt Cap
Sales ( Čcr )
OPM(%)
EPS (Č)
PER(x)
P/BV(x)
RoE(%)
EV/Sales(x)
(Č)
Price ( Č)
( Č cr )
FY17E FY18E
FY17E
FY18E
FY17E
FY18E
FY17E
FY18E
FY17E
FY18E
FY17E
FY18E
FY17E
FY18E
Agri / Agri Chemical
Rallis
Reduce
242
209
4,698
1,937
2,164
13.3
14.3
9.0
11.0
26.8
22.0
4.7
4.1
18.4
19.8
2.5
2.2
United Phosphorus
Neutral
873
-
44,356
15,176
17,604
18.5
18.5
37.4
44.6
23.4
19.6
4.6
3.8
21.4
21.2
3.0
2.6
Auto & Auto Ancillary
Ashok Leyland
Accumulate
106
116
31,065
20,019
22,789
11.1
11.7
4.3
5.5
24.7
19.4
4.8
4.3
19.4
22.0
1.5
1.3
Bajaj Auto
Neutral
2,838
-
82,124
25,093
27,891
19.5
19.2
143.9
162.5
19.7
17.5
5.5
4.8
30.3
29.4
3.0
2.6
Bharat Forge
Neutral
1,138
-
26,500
7,726
8,713
20.5
21.2
35.3
42.7
32.3
26.7
6.0
5.4
18.9
20.1
3.5
3.0
Eicher Motors
Neutral
29,002
-
78,951
16,583
20,447
17.5
18.0
598.0
745.2
48.5
38.9
16.6
12.6
41.2
38.3
4.6
3.7
Gabriel India
Neutral
149
-
2,140
1,544
1,715
9.0
9.3
5.4
6.3
27.6
23.6
5.2
4.6
18.9
19.5
1.3
1.2
Hero Motocorp
Neutral
3,718
-
74,242
28,120
30,753
15.2
15.6
169.1
189.2
22.0
19.7
7.6
6.4
30.8
28.2
2.5
2.2
Jamna Auto Industries Neutral
257
-
2,050
1,486
1,620
9.8
9.9
15.0
17.2
17.2
15.0
3.8
3.2
21.8
21.3
1.4
1.3
L G Balakrishnan & Bros Neutral
763
-
1,198
1,302
1,432
11.6
11.9
43.7
53.0
17.5
14.4
2.5
2.2
13.8
14.2
1.0
0.9
Mahindra and Mahindra Neutral
1,413
-
87,763
46,534
53,077
11.6
11.7
67.3
78.1
21.0
18.1
3.4
3.0
15.4
15.8
1.9
1.6
Maruti
Accumulate
7,578
8,495
228,915
67,822
83,717
15.2
15.0
243.0
291.5
31.2
26.0
7.1
5.8
22.9
22.4
3.1
2.4
Minda Industries
Neutral
777
-
6,712
2,728
3,042
9.0
9.1
68.2
86.2
11.4
9.0
2.6
2.1
23.8
24.3
2.5
2.2
Motherson Sumi
Neutral
322
-
67,871
45,896
53,687
7.8
8.3
13.0
16.1
24.7
20.0
8.0
6.4
34.7
35.4
1.6
1.3
Rane Brake Lining
Neutral
1,334
-
1,056
511
562
11.3
11.5
28.1
30.9
47.5
43.2
7.2
6.6
15.3
15.0
2.2
2.0
Setco Automotive
Neutral
42
-
555
741
837
13.0
13.0
15.2
17.0
2.7
2.4
0.4
0.4
15.8
16.3
1.1
1.0
Tata Motors
Neutral
457
-
131,880
300,209
338,549
8.9
8.4
42.7
54.3
10.7
8.4
1.7
1.4
15.6
17.2
0.6
0.5
TVS Motor
Neutral
571
-
27,123
13,390
15,948
6.9
7.1
12.8
16.5
44.7
34.5
11.1
8.8
26.3
27.2
2.1
1.7
Amara Raja Batteries
Accumulate
847
962
14,474
5,339
6,220
15.9
15.3
28.0
32.3
30.3
26.2
5.8
4.9
19.1
18.5
2.7
2.3
Exide Industries
Neutral
217
-
18,437
7,439
8,307
15.0
15.0
8.1
9.3
26.8
23.3
3.8
3.4
14.3
16.7
2.1
1.9
Apollo Tyres
Neutral
266
-
13,550
12,877
14,504
14.3
13.9
21.4
23.0
12.4
11.6
1.9
1.7
16.4
15.2
1.2
1.1
Ceat
Neutral
1,873
-
7,577
7,524
8,624
13.0
12.7
131.1
144.3
14.3
13.0
2.6
2.2
19.8
18.6
1.1
0.9
JK Tyres
Neutral
167
-
3,790
7,455
8,056
15.0
15.0
21.8
24.5
7.7
6.8
1.6
1.3
22.8
21.3
0.6
0.5
Swaraj Engines
Neutral
2,122
-
2,636
660
810
15.2
16.4
54.5
72.8
38.9
29.2
12.1
11.0
31.5
39.2
3.8
3.1
Subros
Neutral
245
-
1,469
1,488
1,681
11.7
11.9
6.4
7.2
38.3
34.2
4.0
3.7
10.8
11.4
1.2
1.1
Indag Rubber
Neutral
201
-
527
286
326
19.8
16.8
11.7
13.3
17.2
15.1
2.9
2.7
17.8
17.1
1.5
1.3
Capital Goods
ACE
Neutral
71
-
703
709
814
4.1
4.6
1.4
2.1
50.8
33.9
2.1
2.0
4.4
6.0
1.2
1.0
BEML
Neutral
1,656
-
6,897
3,451
4,055
6.3
9.2
31.4
57.9
52.7
28.6
3.2
2.9
6.3
10.9
2.1
1.8
Bharat Electronics
Neutral
176
-
39,200
8,137
9,169
16.8
17.2
58.7
62.5
3.0
2.8
0.5
0.4
44.6
46.3
3.8
3.4
Stock Watch
July 27, 2017
Company Name
Reco
CMP
Target
Mkt Cap
Sales ( Čcr )
OPM(%)
EPS (Č)
PER(x)
P/BV(x)
RoE(%)
EV/Sales(x)
(Č)
Price ( Č)
( Č cr )
FY17E
FY18E
FY17E
FY18E
FY17E
FY18E
FY17E
FY18E
FY17E
FY18E
FY17E
FY18E
FY17E
FY18E
Capital Goods
Voltas
Neutral
498
-
16,463
6,511
7,514
7.9
8.7
12.9
16.3
38.6
30.5
6.9
6.1
16.7
18.5
2.3
1.9
BGR Energy
Neutral
152
-
1,096
16,567
33,848
6.0
5.6
7.8
5.9
19.5
25.8
1.1
1.1
4.7
4.2
0.2
0.1
BHEL
Neutral
144
-
35,233
28,797
34,742
-
2.8
2.3
6.9
62.6
20.9
1.1
1.0
1.3
4.8
0.9
0.6
Blue Star
Accumulate
697
760
6,679
4,283
5,077
5.9
7.3
14.9
22.1
46.9
31.5
9.1
7.7
20.4
26.4
1.6
1.4
CG Power and Industrial
Neutral
85
-
5,321
5,777
6,120
5.9
7.0
3.3
4.5
25.7
18.9
1.1
1.1
4.4
5.9
0.9
0.8
Solutions
Greaves Cotton
Neutral
165
-
4,027
1,755
1,881
16.8
16.9
7.8
8.5
21.1
19.4
4.2
3.9
20.6
20.9
2.0
1.8
Inox Wind
Neutral
134
-
2,964
5,605
6,267
15.7
16.4
24.8
30.0
5.4
4.5
1.5
1.1
25.9
24.4
0.6
0.5
KEC International
Neutral
302
-
7,773
9,294
10,186
7.9
8.1
9.9
11.9
30.5
25.4
4.5
3.9
15.6
16.3
1.1
1.0
KEI Industries
Accumulate
233
258
1,812
2,633
3,001
10.4
10.0
12.7
13.0
18.3
17.9
3.9
3.3
21.4
18.2
0.9
0.8
Thermax
Neutral
906
-
10,792
5,421
5,940
7.3
7.3
25.7
30.2
35.2
30.0
4.3
3.9
12.2
13.1
1.9
1.7
VATech Wabag
Accumulate
598
681
3,261
3,136
3,845
8.9
9.1
26.0
35.9
23.0
16.6
2.9
2.5
13.4
15.9
0.9
0.7
Cement
ACC
Neutral
1,710
-
32,120
11,225
13,172
13.2
16.9
44.5
75.5
38.4
22.7
3.6
3.4
11.2
14.2
2.9
2.4
Ambuja Cements
Neutral
265
-
52,570
9,350
10,979
18.2
22.5
5.8
9.5
45.7
27.9
3.8
3.4
10.2
12.5
5.6
4.8
India Cements
Neutral
212
-
6,533
4,364
4,997
18.5
19.2
7.9
11.3
26.8
18.8
1.9
1.9
8.0
8.5
2.3
2.0
JK Cement
Neutral
988
-
6,908
4,398
5,173
15.5
17.5
31.2
55.5
31.7
17.8
3.8
3.3
12.0
15.5
2.1
1.8
J K Lakshmi Cement
Neutral
459
-
5,395
2,913
3,412
14.5
19.5
7.5
22.5
61.1
20.4
3.8
3.2
12.5
18.0
2.4
2.0
Orient Cement
Neutral
160
-
3,279
2,114
2,558
18.5
20.5
8.1
11.3
19.8
14.2
2.9
2.5
9.0
14.0
2.2
1.7
UltraTech Cement
Neutral
4,077
-
111,936
25,768
30,385
21.0
23.5
111.0
160.0
36.7
25.5
4.7
4.1
13.5
15.8
4.4
3.7
Construction
ITNL
Neutral
93
-
3,046
8,946
10,017
31.0
31.6
8.1
9.1
11.4
10.2
0.4
0.4
4.2
5.0
3.7
3.4
KNR Constructions
Neutral
210
-
2,947
1,385
1,673
14.7
14.0
41.2
48.5
5.1
4.3
1.0
0.8
14.9
15.2
2.2
1.8
Larsen & Toubro
Buy
1,180
1,700
165,186
111,017
124,908
11.0
11.0
61.1
66.7
19.3
17.7
2.3
2.2
13.1
12.9
2.5
2.3
Gujarat Pipavav Port
Neutral
148
-
7,174
705
788
52.2
51.7
5.0
5.6
29.7
26.5
2.9
2.6
11.2
11.2
9.8
8.3
Nagarjuna Const.
Neutral
90
-
5,015
8,842
9,775
9.1
8.8
5.3
6.4
17.0
14.1
1.4
1.2
8.2
9.1
0.7
0.6
PNC Infratech
Neutral
142
-
3,647
2,350
2,904
13.1
13.2
9.0
8.8
15.8
16.2
0.6
0.5
15.9
13.9
1.7
1.4
Simplex Infra
Neutral
489
-
2,420
6,829
7,954
10.5
10.5
31.4
37.4
15.6
13.1
1.6
1.5
9.9
13.4
0.8
0.7
Power Mech Projects
Neutral
585
-
861
1,801
2,219
12.7
14.6
72.1
113.9
8.1
5.1
1.5
1.3
16.8
11.9
0.5
0.4
Sadbhav Engineering
Neutral
287
-
4,929
3,598
4,140
10.3
10.6
9.0
11.9
31.9
24.1
3.3
2.9
9.9
11.9
1.7
1.4
NBCC
Neutral
211
-
18,963
7,428
9,549
7.9
8.6
8.2
11.0
25.7
19.2
1.3
1.0
28.2
28.7
2.3
1.7
MEP Infra
Neutral
126
-
2,050
1,877
1,943
30.6
29.8
3.0
4.2
42.0
30.0
20.3
13.7
0.6
0.6
2.5
2.3
Stock Watch
July 27, 2017
Company Name
Reco
CMP
Target
Mkt Cap
Sales ( Čcr )
OPM(%)
EPS (Č)
PER(x)
P/BV(x)
RoE(%)
EV/Sales(x)
(Č)
Price ( Č)
( Č cr )
FY17E
FY18E
FY17E
FY18E
FY17E
FY18E
FY17E
FY18E
FY17E
FY18E
FY17E
FY18E
FY17E
FY18E
Construction
SIPL
Neutral
106
-
3,718
1,036
1,252
65.5
66.2
(8.4)
(5.6)
4.0
4.5
(22.8)
(15.9)
11.8
9.8
Engineers India
Neutral
163
-
10,967
1,725
1,935
16.0
19.1
11.4
13.9
14.3
11.7
2.0
1.9
13.4
15.3
5.3
4.7
Financials
Axis Bank
Accumulate
529
580
126,775
46,932
53,575
3.5
3.4
32.4
44.6
16.4
11.9
2.1
1.8
13.6
16.5
-
-
Bank of Baroda
Neutral
163
-
37,604
19,980
23,178
1.8
1.8
11.5
17.3
14.2
9.4
1.6
1.3
8.3
10.1
-
-
Canara Bank
Neutral
357
-
21,335
15,225
16,836
1.8
1.8
14.5
28.0
24.6
12.8
1.7
1.4
5.8
8.5
-
-
Can Fin Homes
Neutral
3,050
-
8,118
420
526
3.5
3.5
86.5
107.8
35.3
28.3
7.6
6.2
23.6
24.1
-
-
Cholamandalam Inv. &
Accumulate
1,147
1,230
17,921
2,012
2,317
6.3
6.3
42.7
53.6
26.9
21.4
4.3
3.6
16.9
18.3
-
-
Fin. Co.
Dewan Housing Finance Buy
459
550
14,384
2,225
2,688
2.9
2.9
29.7
34.6
15.5
13.3
2.5
1.6
16.1
14.8
-
-
Equitas Holdings
Buy
169
235
5,716
939
1,281
11.7
11.5
5.8
8.2
29.1
20.6
2.5
2.2
10.9
11.5
-
-
Federal Bank
Accumulate
115
125
22,306
8,259
8,995
3.0
3.0
4.3
5.6
26.7
20.5
2.3
2.1
8.5
10.1
-
-
HDFC
Neutral
1,633
-
260,159
11,475
13,450
3.4
3.4
45.3
52.5
36.1
31.1
7.0
6.1
20.2
20.5
-
-
HDFC Bank
Accumulate
1,750
1,850
450,365
46,097
55,433
4.5
4.5
58.4
68.0
30.0
25.7
5.3
4.4
18.8
18.6
-
-
ICICI Bank
Neutral
310
-
198,930
42,800
44,686
3.1
3.3
18.0
21.9
17.2
14.2
2.3
2.2
11.1
12.3
-
-
Karur Vysya Bank
Buy
137
160
8,297
5,640
6,030
3.3
3.2
8.9
10.0
15.4
13.7
1.6
1.5
11.2
11.4
-
-
Lakshmi Vilas Bank
Neutral
183
-
3,517
3,339
3,799
2.7
2.8
11.0
14.0
16.7
13.1
1.7
1.6
11.2
12.7
-
-
LIC Housing Finance
Neutral
737
-
37,196
3,712
4,293
2.6
2.5
39.0
46.0
18.9
16.0
3.6
3.0
19.9
20.1
-
-
Punjab Natl.Bank
Neutral
159
-
33,792
23,532
23,595
2.3
2.4
6.8
12.6
23.4
12.6
3.6
2.6
3.3
6.5
-
-
RBL Bank
Neutral
528
-
19,897
1,783
2,309
2.6
2.6
12.7
16.4
41.6
32.2
4.5
4.1
12.8
13.3
-
-
Repco Home Finance
Accumulate
782
825
4,890
388
457
4.5
4.2
30.0
38.0
26.1
20.6
4.3
3.6
18.0
19.2
-
-
South Ind.Bank
Neutral
31
-
5,509
6,435
7,578
2.5
2.5
2.7
3.1
11.3
9.9
1.5
1.2
10.1
11.2
-
-
St Bk of India
Neutral
296
-
255,293
88,650
98,335
2.6
2.6
13.5
18.8
21.9
15.7
2.1
1.8
7.0
8.5
-
-
Union Bank
Neutral
160
-
10,968
13,450
14,925
2.3
2.3
25.5
34.5
6.3
4.6
0.9
0.8
7.5
10.2
-
-
Yes Bank
Accumulate
1,713
1,850
78,348
8,978
11,281
3.3
3.4
74.0
90.0
23.1
19.0
4.4
3.7
17.0
17.2
-
-
FMCG
Akzo Nobel India
Neutral
1,768
-
8,478
2,955
3,309
13.3
13.7
57.2
69.3
30.9
25.5
10.1
8.5
32.7
33.3
2.7
2.3
Asian Paints
Neutral
1,134
-
108,730
17,128
18,978
16.8
16.4
19.1
20.7
59.4
54.8
20.7
19.5
34.8
35.5
6.3
5.7
Britannia
Neutral
3,854
-
46,268
9,594
11,011
14.6
14.9
80.3
94.0
48.0
41.0
19.7
15.2
41.2
-
4.7
4.0
Colgate
Neutral
1,066
-
28,984
4,605
5,149
23.4
23.4
23.8
26.9
44.8
39.6
24.8
19.4
64.8
66.8
6.2
5.5
Dabur India
Neutral
306
-
53,920
8,315
9,405
19.8
20.7
8.1
9.2
37.8
33.3
10.5
8.7
31.6
31.0
6.1
5.4
GlaxoSmith Con*
Neutral
5,504
-
23,147
4,350
4,823
21.2
21.4
179.2
196.5
30.7
28.0
8.2
6.9
27.1
26.8
4.7
4.2
Stock Watch
July 27, 2017
Company Name
Reco
CMP
Target
Mkt Cap
Sales ( Čcr )
OPM(%)
EPS (Č)
PER(x)
P/BV(x)
RoE(%)
EV/Sales(x)
(Č)
Price ( Č)
( Č cr )
FY17E FY18E
FY17E
FY18E
FY17E
FY18E
FY17E
FY18E
FY17E
FY18E
FY17E
FY18E
FY17E
FY18E
FMCG
Godrej Consumer
Neutral
1,025
-
69,816
10,235
11,428
18.4
18.6
41.1
44.2
24.9
23.2
5.5
4.7
24.9
24.8
6.9
6.1
HUL
Neutral
1,164
-
252,009
35,252
38,495
17.8
17.8
20.7
22.4
56.4
52.0
53.9
46.2
95.6
88.9
7.0
6.4
ITC
Neutral
293
-
356,828
40,059
44,439
38.3
39.2
9.0
10.1
32.7
29.0
9.1
8.0
27.8
27.5
8.4
7.6
Marico
Neutral
326
-
42,115
6,430
7,349
18.8
19.5
6.4
7.7
51.0
42.4
15.4
13.0
33.2
32.5
6.4
5.5
Nestle*
Neutral
6,787
-
65,440
10,073
11,807
20.7
21.5
124.8
154.2
54.4
44.0
22.3
20.1
34.8
36.7
6.3
5.4
Tata Global
Neutral
172
-
10,868
8,675
9,088
9.8
9.8
7.4
8.2
23.3
21.0
1.8
1.8
7.9
8.1
1.2
1.1
Procter & Gamble
Neutral
8,039
-
26,096
2,939
3,342
23.2
23.0
146.2
163.7
55.0
49.1
13.9
11.6
25.3
23.5
8.4
7.3
Hygiene
IT
HCL Tech^
Accumulate
891
1,014
127,209
46,723
52,342
22.1
20.9
60.0
62.8
14.9
14.2
3.8
3.2
25.3
22.4
2.5
2.1
Infosys
Buy
994
1,179
228,259
68,484
73,963
26.0
26.0
63.0
64.0
15.8
15.5
3.3
3.0
20.8
19.7
3.0
2.7
TCS
Neutral
2,555
-
503,405
117,966
127,403
27.5
27.6
134.3
144.5
19.0
17.7
5.7
5.3
29.8
29.7
3.9
3.6
Tech Mahindra
Buy
389
533
37,960
29,141
31,051
14.4
15.0
32.3
35.6
12.1
10.9
2.1
1.9
17.1
17.0
1.2
1.0
Wipro
Neutral
290
-
141,101
55,421
58,536
20.3
20.3
35.1
36.5
8.3
7.9
1.4
1.2
19.2
14.6
2.0
1.7
Media
D B Corp
Neutral
377
-
6,929
2,297
2,590
27.4
28.2
21.0
23.4
17.9
16.1
4.2
3.6
23.7
23.1
2.8
2.4
HT Media
Neutral
87
-
2,020
2,693
2,991
12.6
12.9
7.9
9.0
11.0
9.6
0.9
0.9
7.8
8.3
0.3
0.2
Jagran Prakashan
Buy
175
225
5,718
2,283
2,555
28.0
28.0
10.6
12.3
16.5
14.3
3.5
3.1
21.4
21.4
2.5
2.2
Sun TV Network
Neutral
805
-
31,724
2,850
3,265
70.1
71.0
26.2
30.4
30.7
26.5
7.9
6.9
24.3
25.6
10.7
9.2
Hindustan Media
Neutral
281
-
2,063
1,016
1,138
24.3
25.2
27.3
30.1
10.3
9.3
2.0
1.7
16.2
15.8
1.4
1.2
Ventures
TV Today Network
Buy
244
344
1,453
608
667
21.5
22.3
15.7
19.2
15.5
12.7
2.4
2.0
16.1
16.0
2.0
1.7
Music Broadcast Limited Buy
363
434
2,071
271
317
91.0
109.0
6.0
10.0
60.5
36.3
3.8
3.4
6.5
9.3
7.2
5.9
Metals & Mining
Coal India
Neutral
260
-
161,455
84,638
94,297
21.4
22.3
24.5
27.1
10.6
9.6
4.4
4.2
42.6
46.0
1.4
1.3
Hind. Zinc
Neutral
285
-
120,253
14,252
18,465
55.9
48.3
15.8
21.5
18.0
13.2
2.9
2.6
17.0
20.7
8.4
6.5
Hindalco
Neutral
221
-
49,626
107,899
112,095
7.4
8.2
9.2
13.0
24.0
17.0
1.2
1.1
4.8
6.6
1.0
0.9
JSW Steel
Neutral
219
-
52,973
53,201
58,779
16.1
16.2
130.6
153.7
1.7
1.4
0.2
0.2
14.0
14.4
1.8
1.5
NMDC
Neutral
124
-
39,153
6,643
7,284
44.4
47.7
7.1
7.7
17.4
16.1
1.5
1.5
8.8
9.2
3.7
3.3
SAIL
Neutral
64
-
26,391
47,528
53,738
(0.7)
2.1
(1.9)
2.6
24.6
0.7
0.7
(1.6)
3.9
1.4
1.3
Vedanta
Neutral
281
-
104,435
71,744
81,944
19.2
21.7
13.4
20.1
21.0
14.0
1.8
1.6
8.4
11.3
1.8
1.5
Tata Steel
Neutral
565
-
54,913
121,374
121,856
7.2
8.4
18.6
34.3
30.4
16.5
1.9
1.7
6.1
10.1
1.1
1.1
Oil & Gas
GAIL
Neutral
376
-
63,542
56,220
65,198
9.3
10.1
27.1
33.3
13.9
11.3
1.3
1.2
9.3
10.7
1.3
1.1
ONGC
Neutral
164
-
210,465
137,222
152,563
15.0
21.8
19.5
24.1
8.4
6.8
0.7
0.7
8.5
10.1
1.8
1.6
Stock Watch
July 27, 2017
Company Name
Reco
CMP
Target
Mkt Cap
Sales ( Čcr )
OPM(%)
EPS (Č)
PER(x)
P/BV(x)
RoE(%)
EV/Sales(x)
(Č)
Price ( Č)
( Č cr )
FY17E FY18E
FY17E
FY18E
FY17E
FY18E
FY17E
FY18E
FY17E
FY18E
FY17E
FY18E
FY17E
FY18E
Oil & Gas
Indian Oil Corp
Neutral
374
-
181,441
373,359
428,656
5.9
5.5
54.0
59.3
6.9
6.3
1.1
1.0
16.0
15.6
0.6
0.5
Reliance Industries
Neutral
1,622
-
527,399
301,963
358,039
12.1
12.6
87.7
101.7
18.5
16.0
1.9
1.7
10.7
11.3
2.2
1.9
Pharmaceuticals
Alembic Pharma
Buy
543
648
10,227
3,101
3,966
19.7
20.5
21.4
25.5
25.4
21.3
5.4
4.4
23.0
22.8
3.3
2.4
Alkem Laboratories Ltd
Buy
1,844
2,161
22,045
5,853
6,901
17.1
18.4
74.6
85.0
24.7
21.7
5.2
4.4
21.1
20.2
3.7
3.2
Aurobindo Pharma
Accumulate
748
823
43,821
14,845
17,086
21.5
22.1
39.4
44.7
19.0
16.7
4.7
3.7
27.6
24.7
3.1
2.7
Aventis*
Neutral
4,294
-
9,889
2,206
2,508
16.6
16.8
128.9
139.9
33.3
30.7
5.7
4.5
21.6
23.5
4.3
3.6
Cadila Healthcare
Sell
548
450
56,065
9,220
11,584
18.4
20.3
14.5
18.7
37.8
29.3
8.1
6.5
23.5
24.6
6.4
4.9
Cipla
Sell
575
461
46,253
14,281
16,619
15.4
16.2
12.5
19.7
46.0
29.2
3.7
3.3
8.4
12.0
3.4
2.9
Dr Reddy's
Neutral
2,711
-
44,928
14,081
15,937
16.1
18.6
72.6
105.9
37.3
25.6
3.7
3.3
9.6
13.6
3.4
3.0
Dishman Pharma
Sell
143
1,718
1,890
22.7
22.8
9.5
11.3
10.1
10.9
3.3
2.9
GSK Pharma*
Neutral
2,479
-
20,994
2,927
3,290
11.8
16.2
34.4
49.6
72.1
50.0
10.5
10.9
13.9
21.3
7.0
6.3
Indoco Remedies
Sell
201
153
1,851
1,067
1,154
12.1
14.9
8.4
11.3
23.9
17.8
2.8
2.5
12.6
15.0
1.9
1.8
Ipca labs
Buy
493
620
6,214
3,211
3,593
13.9
14.5
15.4
19.4
32.0
25.4
2.5
2.3
8.2
9.5
2.1
1.8
Lupin
Buy
1,124
1,526
50,792
17,120
18,657
24.1
24.1
56.9
61.1
19.8
18.4
3.7
3.1
20.7
18.6
3.3
2.7
Natco Pharma
Accumulate
1,001
1,060
17,455
2,065
1,988
33.1
33.7
27.9
25.7
35.9
39.0
10.5
8.9
29.2
22.9
8.5
8.6
Sun Pharma
Buy
578
712
138,784
30,264
32,899
29.0
26.9
32.7
31.6
17.7
18.3
3.8
3.2
22.2
18.7
4.3
3.9
Power
Tata Power
Neutral
83
-
22,328
36,916
39,557
17.4
27.1
5.1
6.3
16.2
13.1
1.4
1.3
9.0
10.3
1.6
1.5
NTPC
Neutral
166
-
136,833
86,605
95,545
17.5
20.8
11.8
13.4
14.1
12.4
1.4
1.3
10.5
11.1
2.9
2.9
Power Grid
Neutral
217
-
113,447
25,315
29,193
88.2
88.7
14.2
17.2
15.3
12.6
2.3
2.0
15.2
16.1
9.1
8.2
Real Estate
Prestige Estate
Neutral
258
-
9,666
4,707
5,105
25.2
26.0
10.3
13.0
25.0
19.8
2.0
1.9
10.3
10.2
3.2
2.9
MLIFE
Buy
428
522
2,197
1,152
1,300
22.7
24.6
29.9
35.8
14.3
12.0
1.1
1.0
7.6
8.6
2.6
2.2
Telecom
Bharti Airtel
Neutral
426
-
170,389
105,086
114,808
34.5
34.7
12.2
16.4
34.9
26.0
2.4
2.2
6.8
8.4
2.5
2.2
Idea Cellular
Neutral
95
-
34,132
40,133
43,731
37.2
37.1
6.4
6.5
14.8
14.6
1.2
1.1
8.2
7.6
1.9
1.6
zOthers
Abbott India
Neutral
4,311
-
9,160
3,153
3,583
14.1
14.4
152.2
182.7
28.3
23.6
139.1
118.8
25.6
26.1
2.6
2.2
Asian Granito
Buy
417
480
1,255
1,066
1,169
11.6
12.5
13.0
16.0
32.1
26.1
3.1
2.8
9.5
10.7
1.5
1.3
Bajaj Electricals
Buy
341
395
3,458
4,801
5,351
5.7
6.2
10.4
13.7
32.7
24.9
4.0
3.6
12.4
14.5
0.7
0.6
Banco Products (India)
Neutral
238
-
1,702
1,353
1,471
12.3
12.4
14.5
16.3
16.4
14.6
22.7
20.4
14.5
14.6
1.2
129.0
Coffee Day Enterprises
Neutral
245
-
5,056
2,964
3,260
20.5
21.2
4.7
8.0
-
30.7
2.8
2.6
5.5
8.5
2.1
1.9
Ltd
Competent Automobiles Neutral
236
-
151
1,137
1,256
3.1
2.7
28.0
23.6
8.4
10.0
45.3
40.9
14.3
11.5
0.1
0.1
Stock Watch
July 27, 2017
Company Name
Reco
CMP
Target
Mkt Cap
Sales ( Čcr )
OPM(%)
EPS (Č)
PER(x)
P/BV(x)
RoE(%)
EV/Sales(x)
(Č)
Price ( Č)
( Č cr )
FY17E
FY18E
FY17E
FY18E
FY17E
FY18E
FY17E
FY18E
FY17E
FY18E
FY17E
FY18E
FY17E
FY18E
zOthers
Elecon Engineering
Neutral
62
-
692
1,482
1,660
13.7
14.5
3.9
5.8
15.8
10.6
3.7
3.4
7.8
10.9
0.8
0.7
Finolex Cables
Neutral
490
-
7,498
2,883
3,115
12.0
12.1
14.2
18.6
34.5
26.4
18.4
16.1
15.8
14.6
2.3
2.1
Garware Wall Ropes
Neutral
895
-
1,959
863
928
15.1
15.2
36.4
39.4
24.6
22.7
4.5
3.8
17.5
15.9
2.2
2.0
Goodyear India*
Neutral
890
-
2,053
1,598
1,704
10.4
10.2
49.4
52.6
18.0
16.9
83.2
73.0
18.2
17.0
1.0
138.4
Hitachi
Neutral
2,011
-
5,467
2,081
2,433
8.8
8.9
33.4
39.9
60.2
50.4
48.6
40.5
22.1
21.4
2.6
2.2
HSIL
Neutral
381
-
2,754
2,384
2,515
15.8
16.3
15.3
19.4
24.9
19.6
24.7
21.3
7.8
9.3
1.3
1.2
Interglobe Aviation
Neutral
1,235
-
44,645
21,122
26,005
14.5
27.6
110.7
132.1
11.2
9.4
66.7
47.7
168.5
201.1
2.1
1.7
Jyothy Laboratories
Neutral
376
-
6,833
1,440
2,052
11.5
13.0
8.5
10.0
44.3
37.6
10.7
9.9
18.6
19.3
5.0
3.5
Kirloskar Engines India
Neutral
400
-
5,782
2,554
2,800
9.9
10.0
10.5
12.1
38.1
33.1
15.9
15.0
10.7
11.7
1.9
1.7
Ltd
Linc Pen & Plastics
Neutral
271
-
401
382
420
9.3
9.5
13.5
15.7
20.1
17.3
3.5
3.0
17.1
17.3
1.1
1.0
M M Forgings
Neutral
611
-
738
546
608
20.4
20.7
41.3
48.7
14.8
12.5
83.7
74.1
16.6
17.0
1.2
1.1
Manpasand Bever.
Neutral
795
-
4,548
836
1,087
19.6
19.4
16.9
23.8
47.1
33.4
5.6
4.9
12.0
14.8
5.2
3.9
Mirza International
Neutral
161
-
1,935
963
1,069
17.2
18.0
6.1
7.5
26.2
21.4
4.0
3.4
15.0
15.7
2.2
2.0
MT Educare
Neutral
74
-
293
366
417
17.7
18.2
9.4
10.8
7.9
6.8
1.7
1.5
22.2
22.3
0.7
0.6
Narayana Hrudaya
Neutral
298
-
6,098
1,873
2,166
11.5
11.7
2.6
4.0
112.8
75.3
6.9
6.3
6.1
8.3
3.4
2.9
Navkar Corporation
Buy
202
265
2,885
347
371
43.2
37.3
6.7
6.0
30.3
33.7
2.1
1.9
6.2
10.6
9.4
8.8
Navneet Education
Neutral
170
-
3,962
1,062
1,147
24.0
24.0
6.1
6.6
27.9
25.6
5.7
5.1
20.6
19.8
3.8
3.5
Nilkamal
Neutral
1,883
-
2,810
1,995
2,165
10.7
10.4
69.8
80.6
27.0
23.4
107.6
93.5
16.6
16.5
1.4
1.3
Page Industries
Neutral
16,786
-
18,723
2,450
3,124
20.1
17.6
299.0
310.0
56.1
54.2
373.9
285.4
47.1
87.5
7.7
6.1
Parag Milk Foods
Neutral
253
-
2,132
1,919
2,231
9.3
9.6
9.5
12.9
26.8
19.6
4.2
3.4
15.5
17.5
1.3
1.1
Quick Heal
Neutral
218
-
1,531
408
495
27.3
27.0
7.7
8.8
28.2
24.8
2.6
2.6
9.3
10.6
2.9
2.4
Radico Khaitan
Accumulate
130
147
1,724
1,667
1,824
13.0
13.2
6.7
8.2
19.5
15.8
1.8
1.6
9.0
10.2
1.4
1.3
Relaxo Footwears
Neutral
485
-
5,823
2,085
2,469
9.2
8.2
7.6
8.0
64.1
61.0
24.9
21.2
17.9
18.8
2.9
2.5
S H Kelkar & Co.
Neutral
275
-
3,975
1,036
1,160
15.1
15.0
6.1
7.2
45.0
38.3
4.8
4.4
10.7
11.5
3.7
3.3
Siyaram Silk Mills
Accumulate
2,315
2,500
2,170
1,574
1,769
12.5
12.7
97.1
113.1
23.8
20.5
3.7
3.2
15.4
15.5
1.6
1.4
Styrolution ABS India*
Neutral
1,110
-
1,953
1,440
1,537
9.2
9.0
40.6
42.6
27.4
26.1
69.8
63.5
12.3
11.6
1.3
1.2
Surya Roshni
Neutral
290
-
1,272
3,342
3,625
7.8
7.5
17.3
19.8
16.8
14.7
31.9
25.6
10.5
10.8
0.6
0.6
Team Lease Serv.
Neutral
1,335
-
2,282
3,229
4,001
1.5
1.8
22.8
32.8
58.6
40.6
6.3
5.4
10.7
13.4
0.6
0.5
The Byke Hospitality
Neutral
206
-
824
287
384
20.5
20.5
7.6
10.7
27.1
19.2
5.7
4.6
20.7
23.5
2.9
2.2
Stock Watch
July 27, 2017
Company Name
Reco
CMP
Target Mkt Cap
Sales ( Čcr )
OPM(%)
EPS (Č)
PER(x)
P/BV(x)
RoE(%)
EV/Sales(x)
(Č)
Price ( Č)
( Č cr )
FY17E FY18E FY17E FY18E FY17E FY18E FY17E FY18E FY17E FY18E FY17E FY18E FY17E FY18E
zOthers
Transport Corporation of
Neutral
319
-
2,442
2,671
2,911
8.5
8.8
13.9
15.7
23.0
20.4
3.1
2.8
13.7
13.8
1.0
0.9
India
TVS Srichakra
Neutral
3,714
-
2,844
2,304
2,614
13.7
13.8
231.1
266.6
16.1
13.9
417.3
328.6
33.9
29.3
1.2
1.1
UFO Moviez
Neutral
386
-
1,065
619
685
33.2
33.4
30.0
34.9
12.9
11.1
1.8
1.5
13.8
13.9
1.4
1.1
Visaka Industries
Neutral
478
-
758
1,051
1,138
10.3
10.4
21.0
23.1
22.7
20.6
61.2
57.3
9.0
9.2
1.0
0.9
VRL Logistics
Neutral
321
-
2,933
1,902
2,119
16.7
16.6
14.6
16.8
22.1
19.1
4.8
4.3
21.9
22.2
1.7
1.5
VIP Industries
Buy
181
218
2,552
1,270
1,450
10.4
10.4
5.6
6.5
32.3
27.8
6.7
5.8
20.7
21.1
2.0
1.8
Navin Fluorine
Accumulate
663
730
3,267
789
945
21.1
22.4
24.0
28.7
27.6
23.1
4.4
3.8
17.8
18.5
4.1
3.3
Source: Company, Angel Research; Note: *December year end; #September year end; &October year end; Price as on July 26, 2017
Market Outlook
July 27, 2017
Research Team Tel: 022 - 39357800
DISCLAIMER
Angel Broking Private Limited (hereinafter referred to as “Angel”) is a registered Member of National Stock Exchange of India
Limited,Bombay Stock Exchange Limited and Metropolitan Stock Exchange Limited. It is also registered as a Depository Participant with
CDSL and Portfolio Manager with SEBI. It also has registration with AMFI as a Mutual Fund Distributor. Angel Broking Private Limited is a
registered entity with SEBI for Research Analyst in terms of SEBI (Research Analyst) Regulations, 2014 vide registration number
INH000000164. Angel or its associates has not been debarred/ suspended by SEBI or any other regulatory authority for accessing
/dealing in securities Market. Angel or its associates/analyst has not received any compensation / managed or
co-managed public offering of securities of the company covered by Analyst during the past twelve months.
This document is solely for the personal information of the recipient, and must not be singularly used as the basis of any investment
decision. Nothing in this document should be construed as investment or financial advice. Each recipient of this document should make
such investigations as they deem necessary to arrive at an independent evaluation of an investment in the securities of the companies
referred to in this document (including the merits and risks involved), and should consult their own advisors to determine the merits and
risks of such an investment.
Reports based on technical and derivative analysis center on studying charts of a stock's price movement, outstanding positions and
trading volume, as opposed to focusing on a company's fundamentals and, as such, may not match with a report on a company's
fundamentals. Investors are advised to refer the Fundamental and Technical Research Reports available on our website to evaluate the
contrary view, if any.
The information in this document has been printed on the basis of publicly available information, internal data and other reliable
sources believed to be true, but we do not represent that it is accurate or complete and it should not be relied on as such, as this
document is for general guidance only. Angel Broking Pvt. Limited or any of its affiliates/ group companies shall not be in any way
responsible for any loss or damage that may arise to any person from any inadvertent error in the information contained in this report.
Angel Broking Pvt. Limited has not independently verified all the information contained within this document. Accordingly, we cannot
testify, nor make any representation or warranty, express or implied, to the accuracy, contents or data contained within this document.
While Angel Broking Pvt. Limited endeavors to update on a reasonable basis the information discussed in this material, there may be
regulatory, compliance, or other reasons that prevent us from doing so.
This document is being supplied to you solely for your information, and its contents, information or data may not be reproduced,
redistributed or passed on, directly or indirectly.
Neither Angel Broking Pvt. Limited, nor its directors, employees or affiliates shall be liable for any loss or damage that may arise from
or in connection with the use of this information.